
The Sessions paper: an analytical critique
Roger Sessions has published a white paper, “The IT Complexity Crisis: Danger and Opportunity” (PDF). It’s created a bit of a stir in tech circles, largely because Sessions estimates that “worldwide, we are already losing over USD 500 billion per month on IT failure, and the problem is getting worse” (page 1; emphasis in original). He feels that the consequence is a “coming IT meltdown”, then goes on to offer his own solution, namely designing simpler IT systems.
This naturally intrigued me, since for the last 15 years, I have been writing, consulting, lecturing, and testifying about troubled and failed IT projects. While there are indeed tremendous financial losses due to late and failed IT projects, the figures Sessions gives seem much too large to me, and so I decided to do this critique of his analysis.
Sessions is good enough to provide the basis of his estimates and calculations, including footnotes. But that’s where some of the problems start. For example, on page 3, Sessions cites (his footnote ’02’) to the US Budget, Fiscal Year 2009, Analytical Perspective (PDF), p. 169, for information on “at-risk” or failed IT projects, specifically:
- “According to the 2009 U.S. Budget [02], the failure rate is increasing at the rate of around 15% per year. If this trend continues, within another five years or so a total IT meltdown may be unavoidable.” (p. 3)
- “According to the 2009 U.S. Budget [02], 66% of all Federal IT dollars are invested in projects that are ‘at risk’. I assume this number is representative of the rest of the world.” (p. 3, in “Calculating the Cost of IT Failure” box)
- A large number of these [‘at risk’ projects] will eventually fail. I assume the failure of an ‘at risk’ project is between 50% and 80%. For this analysis, I’ll use the average: 65%.”
These three statements run into immediate problems. First, and relatively minor, Sessions gets his page number wrong: he’s citing “page 169” of the Analytical Perspective document, but there is no discussion whatsoever on page 169 of that document about IT projects. However, page 157 of that document (which happens to be page 169 of the PDF document) does start a section titled “INTEGRATING SERVICES WITH INFORMATION TECHNOLOGY”, so I presume that Sessions made the simple mistake of using the PDF page count rather than the document’s actual page numbering.
Even so, serious problems remain with Sessions’ citations and analysis.
Page 157 of the Analytical Perspective document does not say what Sessions claimed in the two comments above. I have not been able to figure out where Sessions gets his figure for “the failure rate increasing around 15% per year” from the cited US Budget Analytical Perspective document, much less his conclusion that “if this trend continues, within another five years or so a total IT meltdown may be unavoidable.” As far as I can tell, the Analytical Perspective document does not talk about failed IT projects at all, much less the increase in failure rates.
Furthermore, the phrase “the failure rate increasing around 15% per year” is itself ambiguous and may not be that significant. To start with an arbitrary number, assume that 100 projects “fail” in a given year. If “the failure rate [is] increasing around 15% per year”, then that means that 115 projects would fail the next year, and 132 projects would fail the year after that. But unless we know both the actual number of failed IT projects and the total number of IT projects in that same year, Sessions’ figure tells us nothing. If there’s only 150 IT projects total, then the 15% failure rate increase becomes very significant; if there’s 1000 IT projects total, then we’re many years away from Sessions’ threatened “meltdown”.
Sessions also ignores or confuses the failure rate for new projects vs. the systems already deployed. In other words, the failure rate for new systems development says very little about the continued functionality of existing, deployed systems now in use. While there are occasions (most notably Y2k, now a decade behind us) where existing IT systems just won’t function or function properly if they aren’t fixed or replaced, by and large both governments and private concerns have gotten along remarkably well for years or even decades with antiquated systems
As for Sessions’ second statement, there is a table on page 158 that may represent the basis for it:
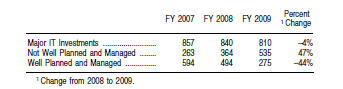
As can be seen in the FY 2009 column, 66% (535 out of 810) of the FY 2009 “Major IT Investments” are projects that are “Not Well Planned and Managed”. Note that this table does not (as Sessions infers) indicate Federal dollars but rather actual projects; that is, in FY 2009, there are 810 projects listed as “Major IT investments”, of which 535 are designated as “Not Well Planned and Managed”. The previous page appears to indicate that these projects represent $27 billion, which is roughly 38% of the proposed Federal IT budget — not a great figure, but still almost half of the 66% that Sessions claims.
What’s more, supplementary data (PDF) for the FY 2009 Analytical Perspective makes it clear that the US Government’s designation of such projects — which puts them on a “Management Watch List” (WML) — has reduced the risk of such projects during each fiscal year:
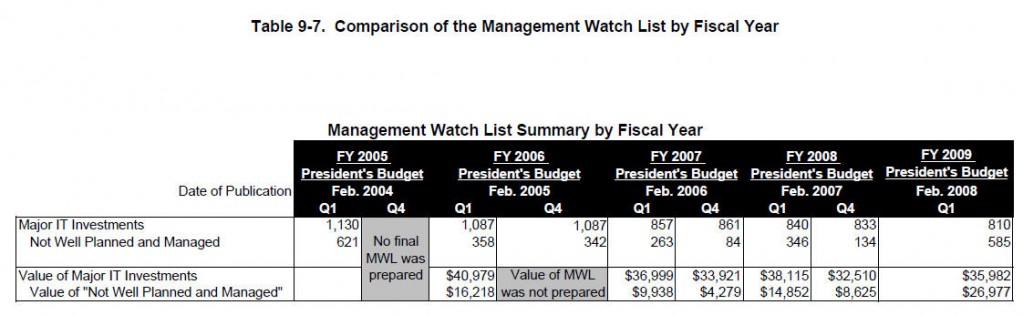
Note that in FY 2007 and 2008, the number of IT projects designated as “Not Well Planned and Managed” shrunk significantly during the year (from Q1 to Q4) without a proportional shrinkage of the overall number of major IT projects. In other word, it appears that the government’s efforts to remove such projects from the “Not Well Planned and Managed” category is relatively successful. And the actual US IT budget dollars at risk at the end of each of those fiscal years ($4.2 billion for FY 07, $8.6 billion for FY 08) is a much smaller percentage (6.5% and 13%, respectively) of the Federal IT budget for each of those years ($64.2 billion for FY 07 (XLS), $66.4 billion for FY 08 (XLS)).
Sessions then states that “I assume this number [66% of all Federal IT dollars being at risk] is representative of the rest of the world.” There are numerous problems with this assumption, starting with the fact that the 66% figure is wrong; in fact, the actual “at risk” (his term, not the US Government’s) percentage of the IT budget at the end of FY 07 and FY 08 were, as noted above, 6.5% and 13%, respectively.
Sessions’ error here is significant, since he goes on in several places (cf. page 4) to cite his use of the % of the total IT budget as being significant, when he’s not talking about the total IT budget at all.
Furthermore, it is unclear whether his phrase “the rest of the world” means all other national governments, or all other entities doing IT project development. It seems to be the latter, though it’s hard to tell from his statements. On the other hand, I have spent years consulting with corporations on troubled projects, and I can tell you that they do not have 66% of their IT budgets devoted to “at risk” projects. In fact, the majority of corporate IT budgets are devoted to maintenance of existing systems, not new and risky projects (cf. here, here, here, and here, as simple examples).
As noted, Sessions then assumes that the failure rate for “at risk” IT projects is 65%, which means that (as he says) “I am calculating that 43% (.65 x .66) of the total IT budget” is devoted to failed projects. At this point, his figures become nonsensical, as they are derived both from misreadings and lack of complete information about the Federal IT budget and projects. To wit:
- The 535 “not well planned and managed” IT projects in the US FY 09 budget only represent 38% of the total IT budget, not 66% as Sessions mistakenly states.
- In the two previous years (FY 07 and FY 08), the number of IT projects labeled as “not well planned and managed” dropped during the course of each year (see the 2nd table above). In FY 07, it dropped from 263 projects in Q1 to just 84 in Q4, which means that 69% were moved off of the “not well planned and managed” list during the year. Likewise, in FY 08, it dropped from 346 projects in Q1 to 134 projects in Q4, a drop of 61%. This directly contradicts Sessions’ assumption of a 65% failure rate for projects in the “not well planned and managed” category.
- The FY ’09 Analytical Perspective says nothing about actual failed projects, as far as I can tell.
Sessions then goes on to make further out-of-his-hat assumptions regarding “direct and indirect costs”. He cites an example of the IRS (an agency long troubled by IT woes) and notes a lost opportunity based on fraudulent tax returns due to the system not being operational. He projects a loss over two years ($1.788 billion), compares it to the cost of the failed modernization ($185 million over a ten-year period), and calculates an indirect costs ratio of 9.6 to 1. He then decides — with no other documentation or analysis whatsoever — that the universal ratio of indirect to direct costs for a failed IT project ranges from 5:1 to 10:1, and uses the “average” of 7.5:1.
There are so many problems here that I scarce know where to start. For starters, the term “average” assumes an even distribution of ratios from 5:1 to 10:1 and does not recognize any ratios lower than 5:1. I’ve seen many failed projects that had much lower ratios of “indirect” to “direct” costs, since the firm simply continued to operate using the existing systems, and the “lost opportunity” for not having the new system in place was relatively small.
More importantly, the IRS gets to collect taxes from the entire US: $2.5 trillion in tax collections each year. Using the IRS as a baseline makes little sense for most other government agencies, and even less sense for most corporations and non-government organizations (NGOs), because most IT systems in most organizations (government or private) do not have the ability to generate such magnitudes of revenue, period.
Indeed, there is a long-standing controversy within IT management circles as to whether a new computer system can be relied upon to provide any significant return on investment (ROI), or whether it exists merely to “keep up with the competition”.
Sessions concludes his section on calculations thusly (p. 5, emphasis his):
Of course, these calculations are estimates. I recommend you don’t get overly focused on the exact amounts. I could be off by ten or twenty percent in either directions. The real point is not the exact numbers, but the magnitude of the numbers and the fact that the numbers are getting worse.
Unfortunately, Sessions is fundamentally wrong in his numerical analysis, and his numbers are off by far more than “ten or twenty percent”. For the Federal Government alone, they are off by almost a full order of magnitude (10x), due to his critical errors both on the percentage of the Federal IT ’09 budget “at risk” (it’s 38%, not 66%) and the number of “at risk” projects that fail (he says 65%; the US government numbers for FY 07 and 08 show that only 35% of the projects — representing just 6.5% to 13% percent of the Federal IT budget — were still “at risk” at the end of each fiscal year, and it gives no figures that I can find for actual failed IT projects).
Furthermore, his projection of the (erroneous) 66%-of-IT-budget-at-risk figure on the rest of the world is just wrong, especially in corporations and business (which spend vastly more on IT than the US government). In those organizations, maintenance costs dominates, and the percentage of the IT budget devoted to new projects tends to be small (20% or less), with an even smaller fraction of that representing “at risk” projects.
I may comment more on Sessions’ paper, but my conclusion here is that his estimate of $500 billion/month in lost direct and indirect costs due to IT systems failure just does not hold up, in my opinion. ..bruce..
Comments (5)
Trackback URL | Comments RSS Feed
Sites That Link to this Post